When we talk about the environmental footprint of electricity, especially for data centres, we usually look at emissions. Grams of CO₂e per kilowatt-hour has become the standard reporting measure, and it's an important one. But power plants also use water, mostly for cooling and, in the case of hydropower, through evaporation from reservoirs. A litre used where water is scarce matters far more than a litre used where it's plentiful.
So we asked a simple question: if you pick a region for its low-carbon electricity, is it also low-water?
What we did
We analysed every half-hour of 2025 for the 14 grid regions of Great Britain and the 12 regions of mainland France, using public data:
- Carbon: NESO's regional carbon intensity for Great Britain. For France, no official regional figure exists, so we estimated it with RTE's own method and emission factors, applied to each region's generation mix. The approach reproduces RTE's published national figure to within about 1 g/kWh.
- Water: each region's generation mix multiplied by the water each technology consumes per kWh (WRI/WSP), then weighted by how scarce water is in that region and month (AWARE 2.0, the scarcity method recommended for life-cycle assessment).
What we found
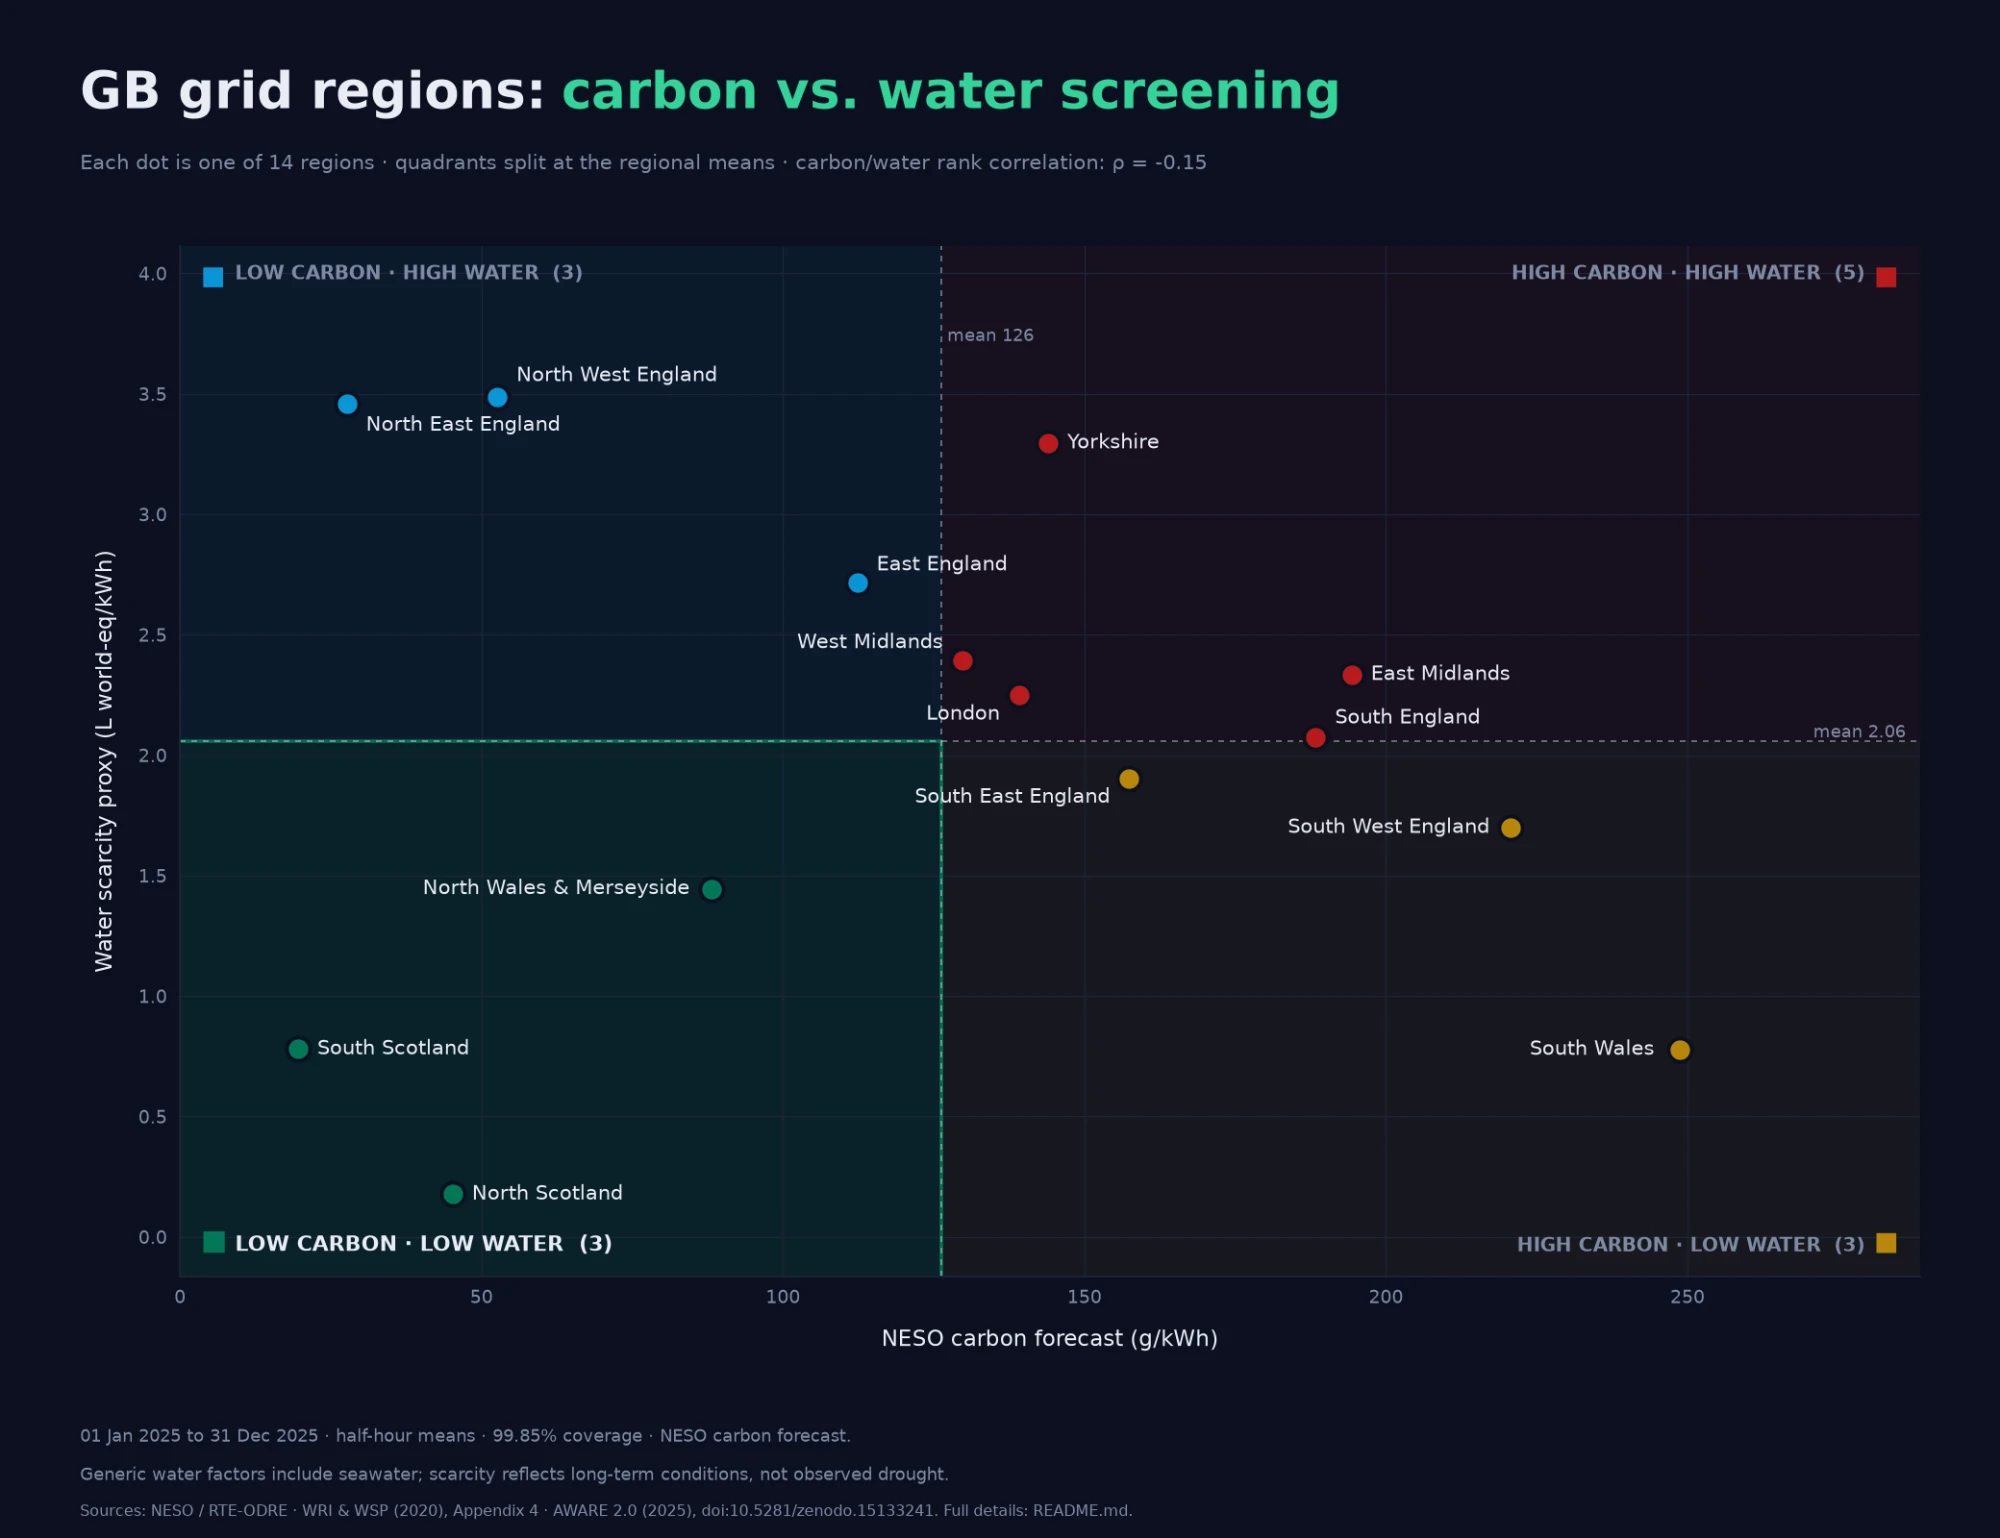
The two rankings barely agree. In both countries the rank correlation between carbon and water is close to zero, even slightly negative (-0.15 in Great Britain, -0.17 in France). Knowing a region's carbon intensity tells you almost nothing about its water impact.
In Great Britain:
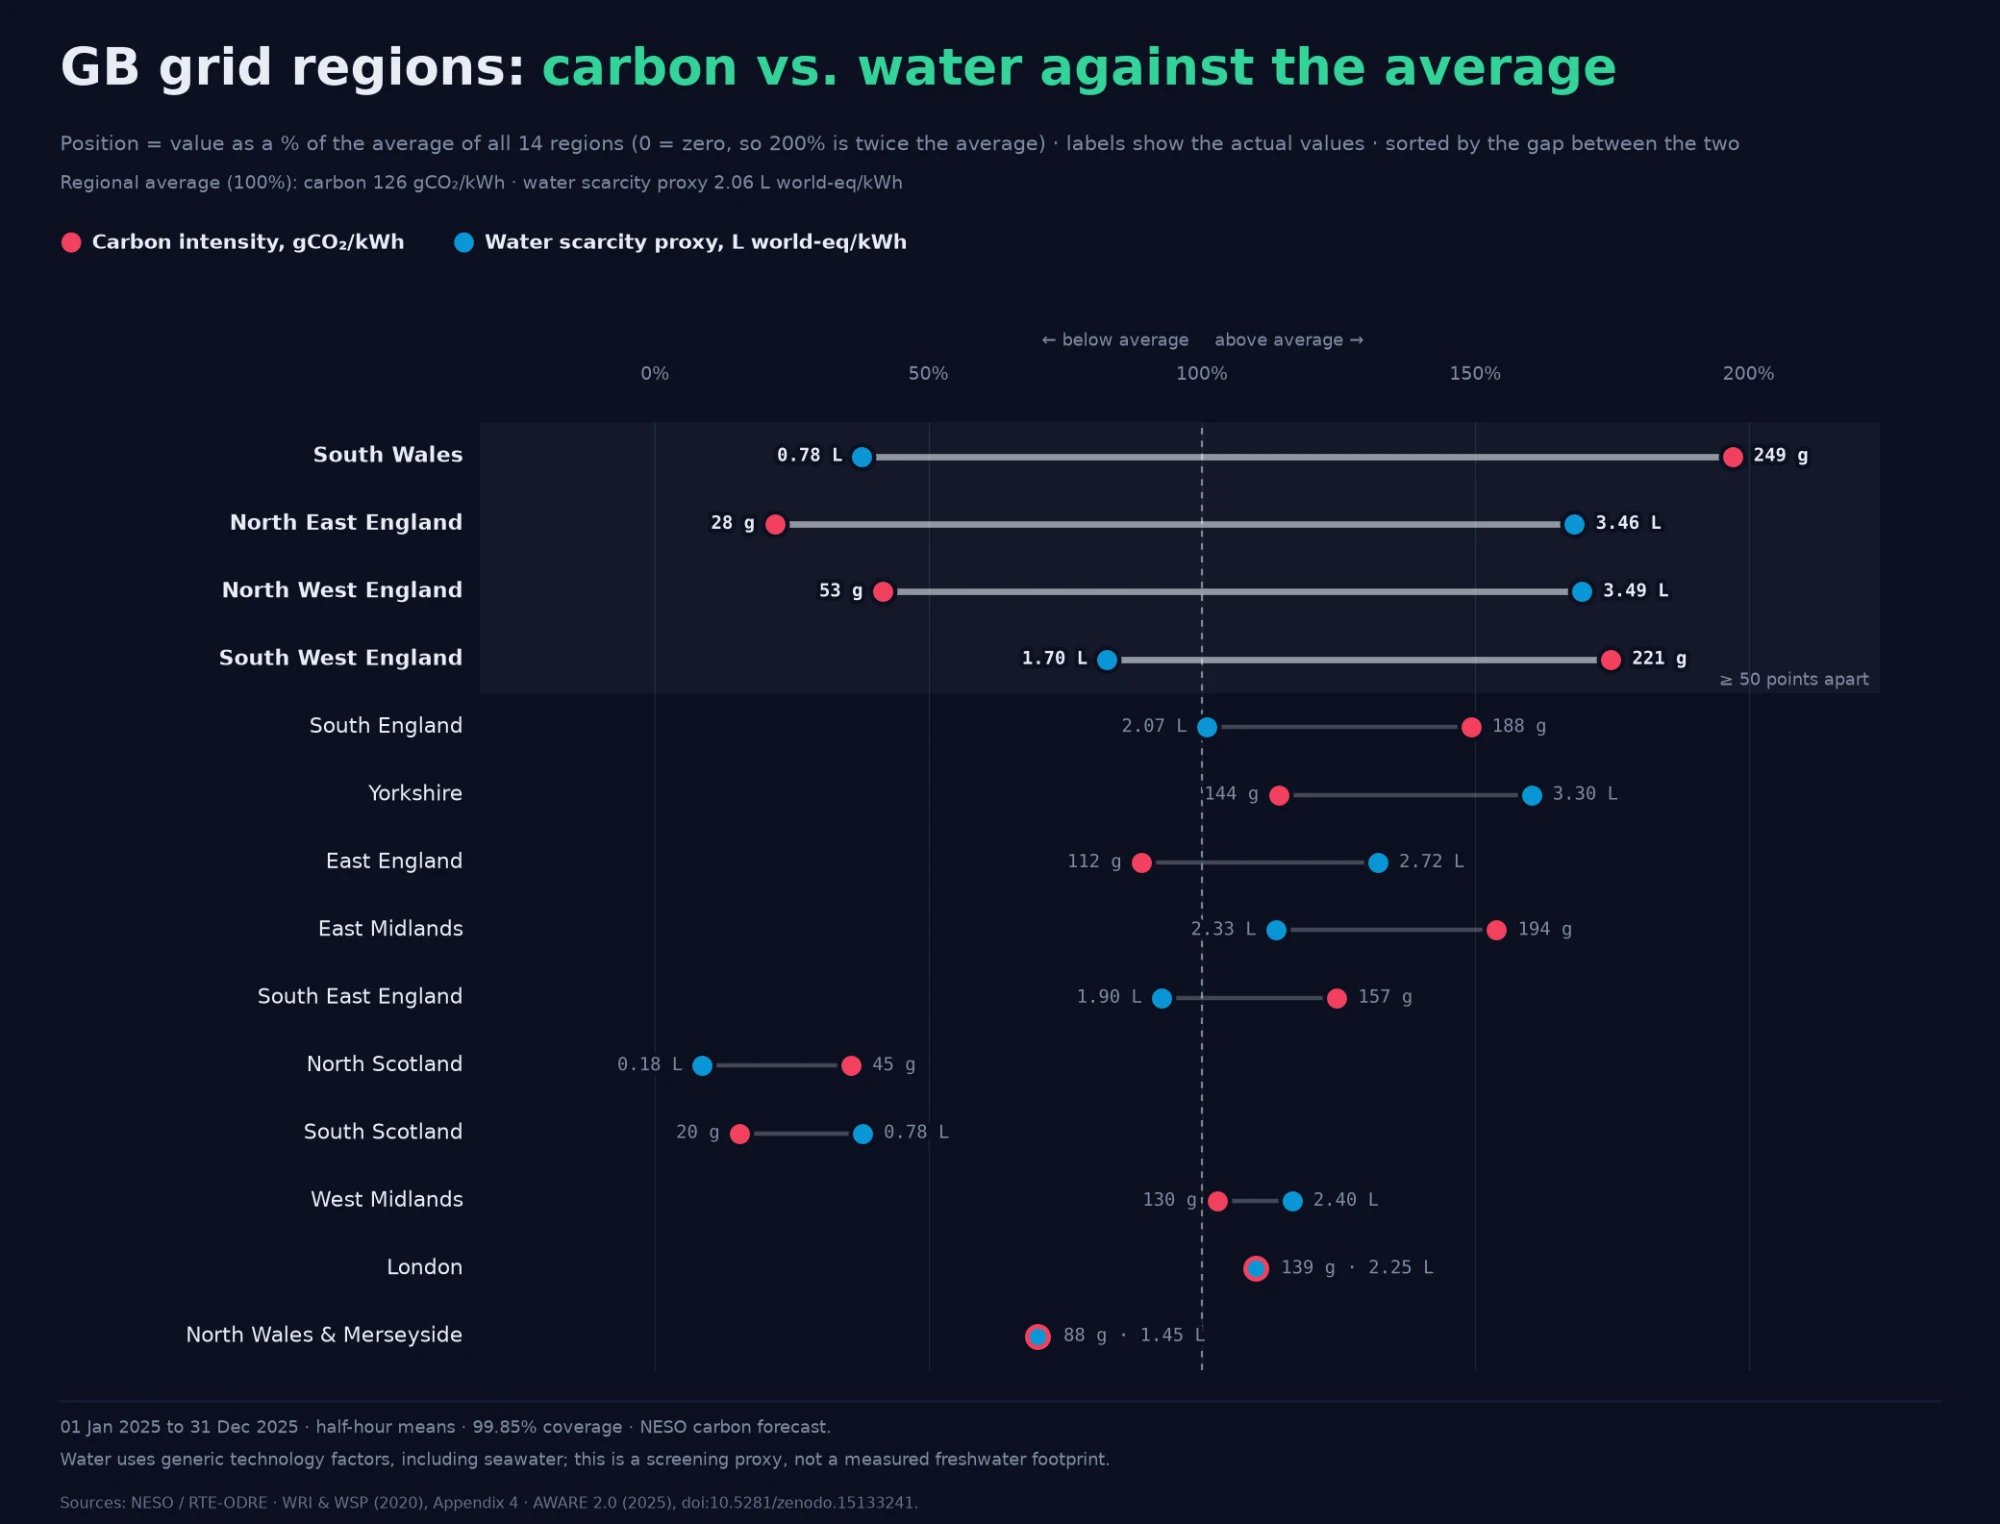
- South Wales has the most carbon-intensive electricity (about 249 g/kWh, mostly gas) but the second-lowest water score.
- North East and North West England are among the lowest-carbon regions (28 and 53 g/kWh) but score highest on water.
- North Scotland is the only region close to the best on both: mostly wind, low water stress.
In France:
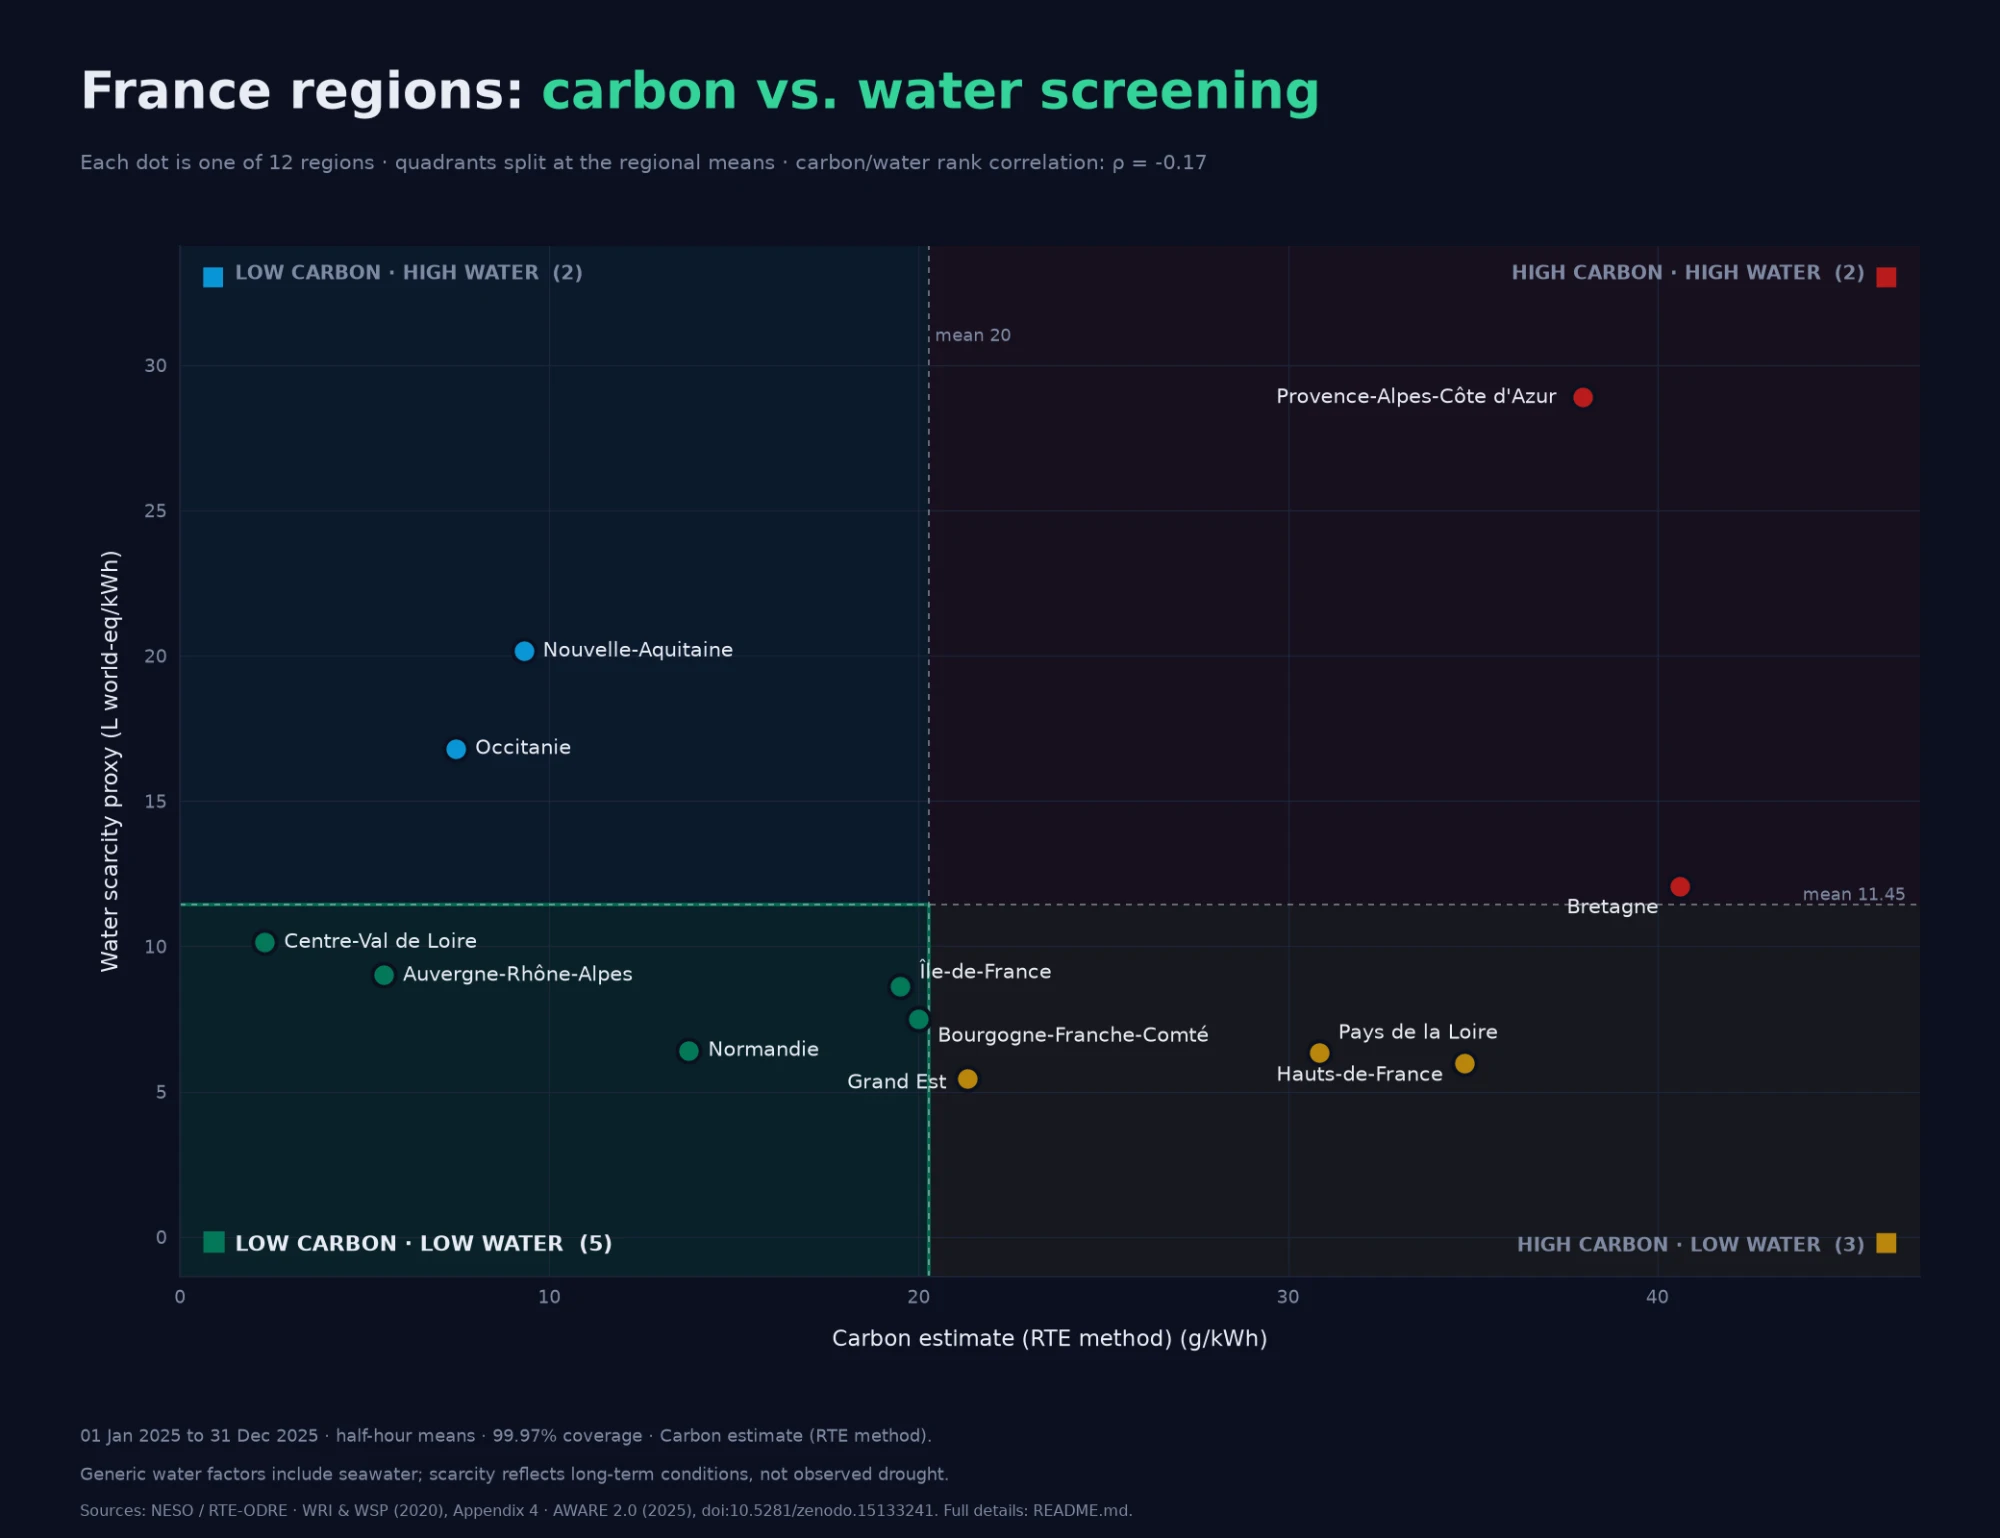
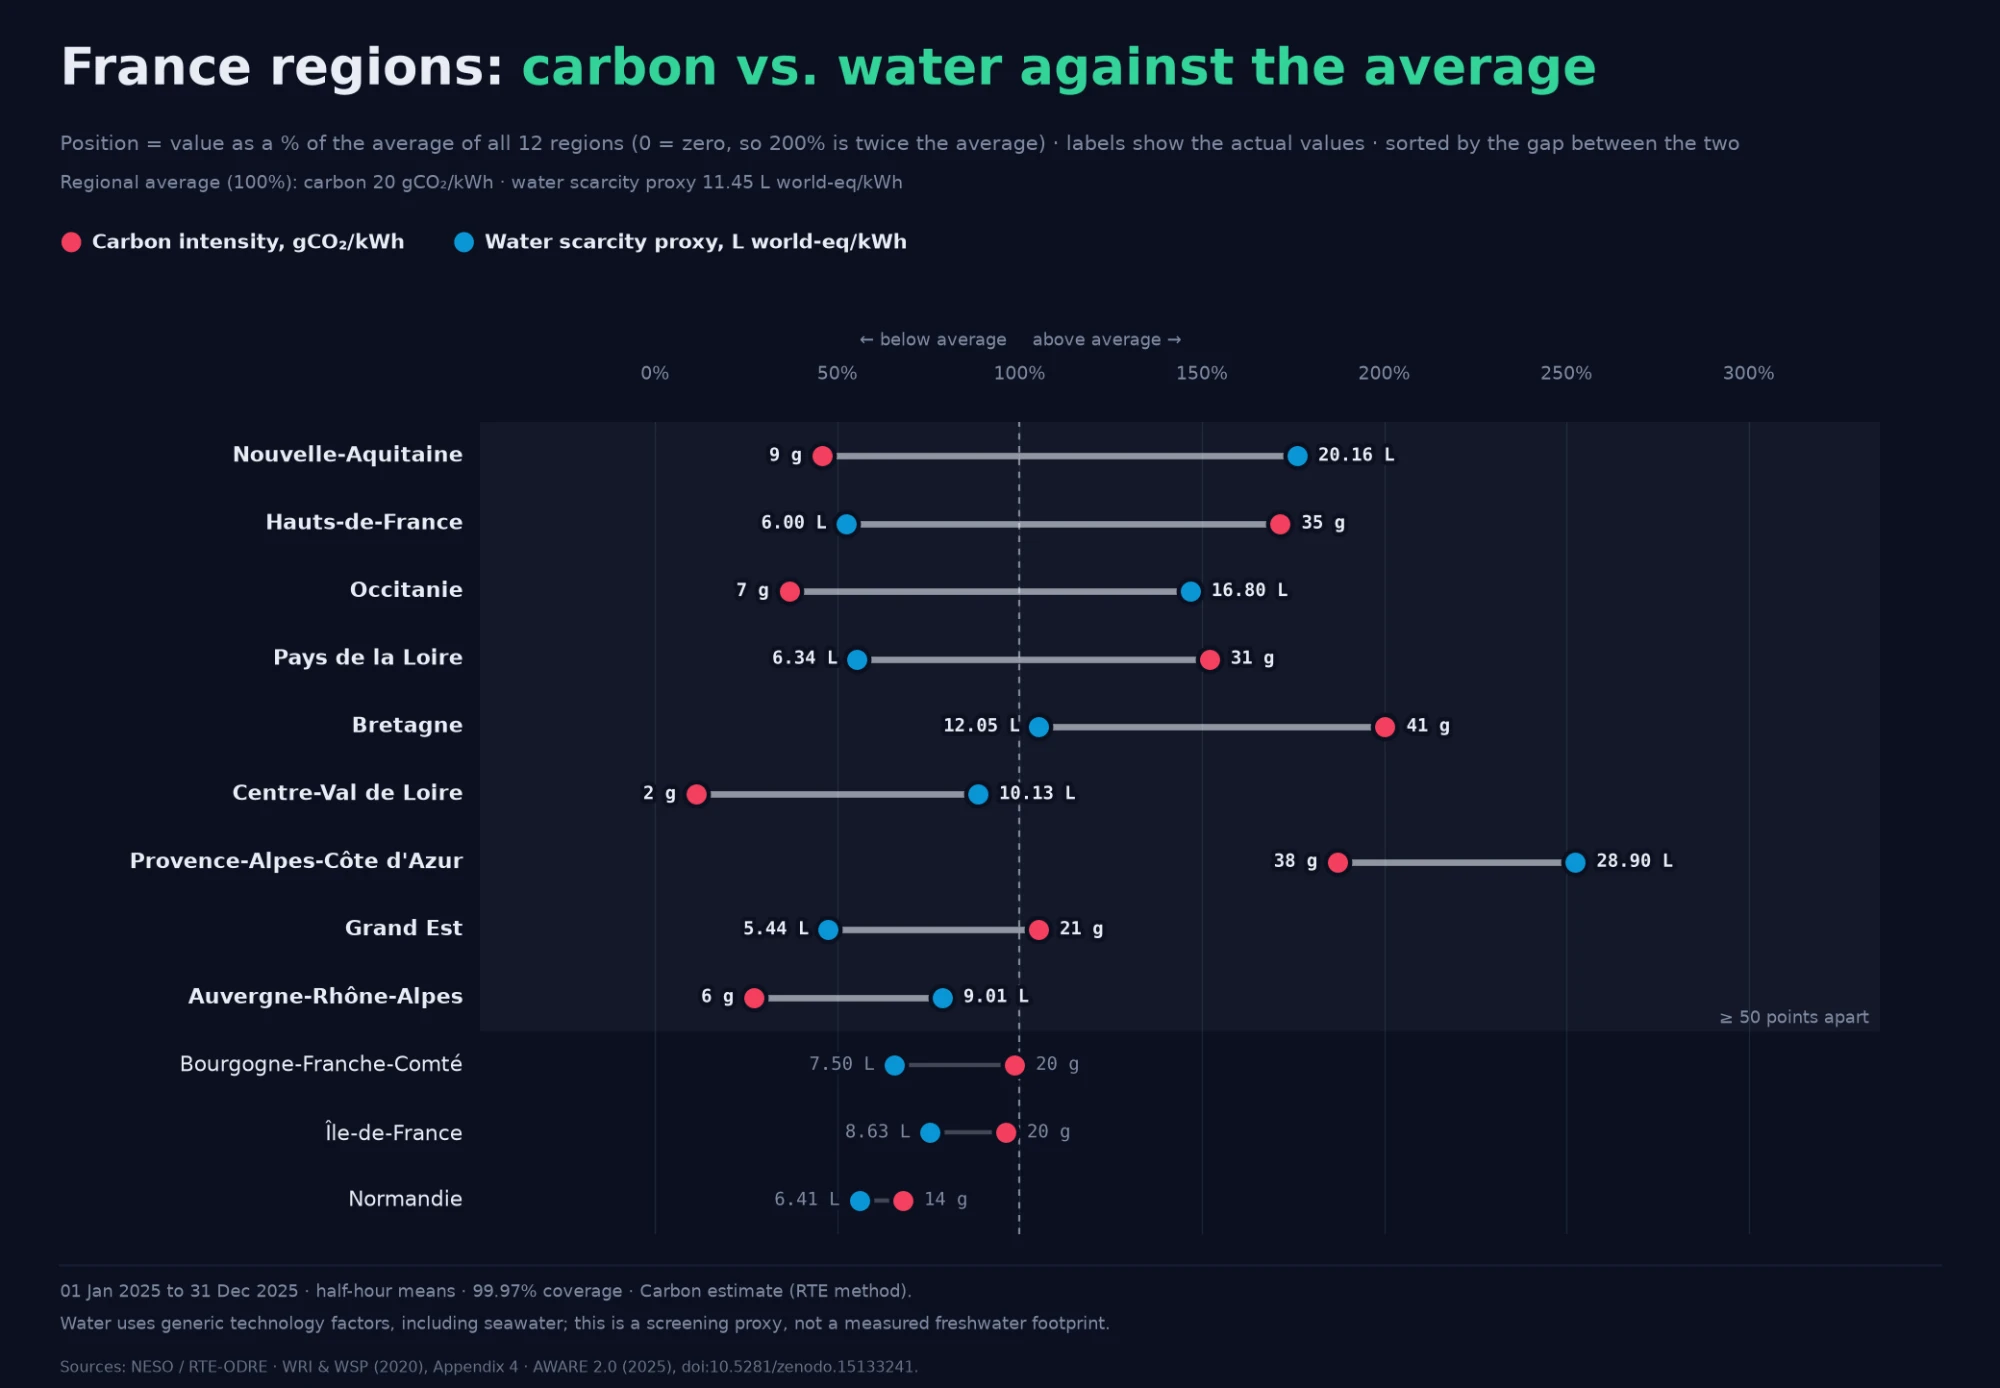
- Carbon is low everywhere (about 20 g/kWh on average), so water is where regions really differ: the highest water score is more than five times the lowest.
- Occitanie and Nouvelle-Aquitaine are among the lowest-carbon regions but have high water scores, driven by hydropower and higher water stress in the south.
- Grand Est and Hauts-de-France are the reverse: above-average carbon, lowest water.
- Provence-Alpes-Côte d'Azur is high on both.
Why it matters
Suppose a company chooses where to run a workload, or site a data centre, based on carbon alone. In Great Britain, moving from South Wales to North East England would cut grid carbon by almost 90%, while the water score rises more than fourfold. On a carbon-only dashboard, that looks like an unqualified win.
Carbon and water are two different constraints, and optimising one can quietly make the other worse. Both should be on the table when deciding where electricity is used.
This is the thinking behind Interact Verify's new water analysis. Its Environmental Compliance simulation takes facility water data alongside your servers and energy, so you can see your position against the EU frameworks for data centres in one run.
Caveats
This is a screening analysis for comparing regions, not a measured water footprint.
- Water is modelled, not measured. It uses generic water factors for each technology, not individual power stations or their cooling systems.
- The factors include seawater, while the scarcity weighting concerns freshwater. This mainly overstates Great Britain's coastal nuclear stations, which drive the high water scores in North East and North West England.
- Hydropower is counted at its highest water use. All reservoir evaporation counts towards electricity, which raises the scores of hydro-heavy regions such as southern France.
- Water scarcity is a long-term average, not 2025's actual conditions, and it covers Great Britain only by nation, so all English regions share the same scarcity value.
- Carbon is partly estimated. NESO's values for Great Britain are forecasts, and France has no official regional figure, so it's estimated with RTE's method. Both count direct combustion emissions only.
- Imported electricity is approximated, not traced to its actual source.
- Compare regions within a country, not across them. Great Britain and France use different carbon methods.
We'd welcome feedback, especially from anyone working on water in energy systems or data-centre sustainability.
To see where your estate stands, buy a simulation or talk to us.