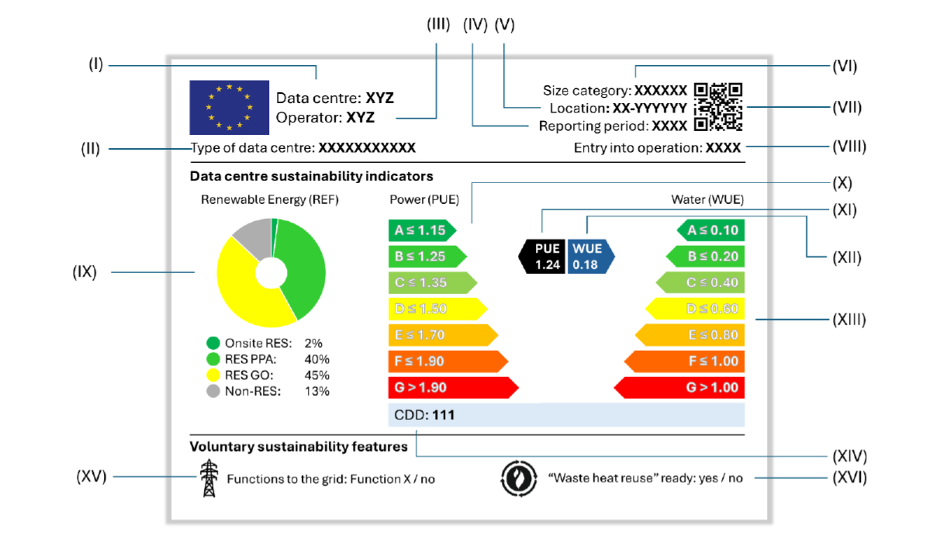
By August 2027, every data centre in Europe above 500 kW of IT power should carry an automatically generated electronic label. It shows two grades, A to G, one for Power Usage Effectiveness (PUE) and one for Water Usage Effectiveness (WUE), plus a Renewable Energy Factor (REF) breakdown. Here is how the label works, what it misses, and why the details matter more than the grades.
How we got here
In March 2024, the Commission introduced legislation in Delegated Regulation 2024/1364. It does not rate anything. It builds the base layer: a European database, a list of things operators must measure, and rules for how to measure them. Every site above 500 kW of installed IT power reports once a year, by 15 May, covering the previous calendar year.
This year, a rating scheme, the label, is added on top through the 2026 Delegated Act, still in draft. The act also goes back and fixes parts of the 2024 rules, so the data is good enough to grade. Nothing new gets measured for the label. Every number on it comes from data already being collected.
What gets measured
Operators report roughly two dozen data points listed in Delegated Regulation 2024/1364. The main ones are:
- Energy: total energy the site uses, and the energy the IT equipment uses. Both are metered at specific points, which is what makes the numbers comparable. Total energy is measured at the input of the data centre, before the supply transfer switchgear. IT energy is now measured at rack level.
- Water: total water and fresh water entering the site.
- Renewable energy: split into three buckets, bought certificates (guarantees of origin), power purchase agreements, and on-site generation.
- Heat reuse: how much waste heat is exported and reused outside the site, and at what temperature.
- ICT capacity: server efficiency, calculated as the sum of SERT active performance (interpolated from the SERT database where the exact configuration is not published) and the total capacity of all SSD and HDD devices.
- Other: cooling setpoints, refrigerant types, cooling degree days for the location, and whether the site provides services to the grid.
What the label displays
From the reported data, the following KPIs are calculated:
| Indicator | What it means |
|---|---|
| PUE = total energy ÷ IT energy | How much energy the building burns around the IT |
| WUE = water ÷ IT energy | Litres of fresh water per kWh of IT |
| REF = renewable energy ÷ total energy | Share of renewable supply |
PUE and WUE are graded A to G. PUE A is ≤1.15, G is >1.90; WUE A is ≤0.10, G is >1.00.
REF is split into four categories:
- Onsite RES: local renewable generation, such as on-site solar.
- RES PPA: renewable energy from long-term power purchase agreements.
- RES GO: renewable energy certificates.
- Non-RES: the remainder, non-renewable grid supply plus any on-site fossil generation.
The label also carries cooling degree days for the location, showing the climate the site cools against; an Energy Reuse Factor reduced to a Yes/No readiness flag; a Yes/No field for whether the site provides functions to the grid; and a QR code linking to the label's entry in the public area of the European database.
What changed in the 2026 draft
The most useful fixes are to the underlying rules:
- Heat reuse no longer hurts your PUE. Before, running a heat pump to warm exported heat counted against you. Now that energy is subtracted from the calculation, so sites are no longer penalised for doing a good thing.
- IT energy is now measured at the rack. It used to be captured further upstream, at the UPS or the power distribution unit, and moving the meter changes PUE itself. Energy lost in distribution between the UPS and the rack stops counting as IT energy and lands on the overhead side of the ratio, a smaller denominator and so a higher number.
- Water switched from potable to freshwater, so river and groundwater abstraction now counts alongside tap water. Water returned from closed cooling loops is excluded, so you measure what you consume.
- Data traffic indicators were deleted.
- A new field for third-party certification of your reported data was added, optional for now.
- Location is reported at region level, coarser than the previous local level, though each site still gets its own label.
The most argued-over change was renewable certificates. The March draft excluded nuclear and old hydro, so a data centre on France's near-carbon-free grid would have shown a nearly empty doughnut. MEPs objected in May. The July draft added a separate low-emission category covering nuclear and softened the baseline.
Strengths and blind spots
The measurement rules are well written. Anyone who has tried to compare two operators' PUE figures knows they usually cannot, because nobody metered at the same place. The new rules fix that.
The renewable breakdown, shown as a doughnut chart on the label, does more against greenwashing than most disclosure rules manage. Any operator claiming 100% renewable on the back of bought certificates will now see that claim broken into its parts, side by side, on a regulated document.
The label is not issued alone. A supplementary document accompanies it, explaining how PUE depends on local climate, how both grades shift with size and age, the trade-off between PUE and WUE, the differences between renewable categories, and how much a WUE value should matter given local water stress. The Commission has anticipated most of the obvious misreadings.
The limitation is that this document is common to all labels. It can explain that local water stress changes how a WUE grade should be read, but it cannot say what the water stress is at that site. The document speaks in general terms and cannot address the specific conditions at any one site, and reporting location at regional level, coarser than the site itself, makes the gap harder to close afterwards. Adding grid carbon intensity and a water stress factor would narrow it.
The critical gap is that neither the label nor the document shows whether the servers do anything useful. Both grades divide by IT energy. So if you run your servers at low utilisation, you burn more IT energy for the same work, and both PUE and WUE grades improve. Idle GPU clusters kept warm for burst capacity are close to the perfect profile for scoring well. DIGITALEUROPE's position paper on the scheme asks that any new IT metric stay off the label before 2030, when the relevant standards are expected to be in place. The absence is contested ground, which makes the 2028 review the place where it might get settled.
The bigger question is whether the submitted data is good enough to grade. Green Web Foundation's analysis of the first EED reporting round found participation well below what the Commission's own researchers expected. Czechia reported nothing at all, and Ireland, one of the most politically contested markets in Europe, saw roughly one facility in six report. A label generated automatically from that base inherits its gaps.
Enforcement does not obviously fix it. Penalties sit at national level, because the Energy Efficiency Directive has to be transposed first, and they currently run to tens of thousands of euros against an electricity bill of at least 600,000 euros a year for even the smallest 0.5 MW site in scope. For a large facility the fine is a rounding error on a monthly invoice.
The bottom line
Rigorous rules, a genuinely good renewable breakdown, and necessary fixes. But the grades on the label measure the energy spent around the computing. They do not capture the useful work the servers do, or the absolute scale of either.
The real prize is the database underneath. It will be the first consistent, comparable, annually refreshed picture of where Europe's digital infrastructure spends its energy and water. Whether the label catches up with it is a question for the review due in 2028.